The cumulative flow shows the statuses of issues over time which allows you to spot potential bottlenecks early on. Using the cumulative flow you can quickly see how your project is making progress on issues by comparing the creation of issues and the closing of issues. You can use this information to act quickly when the open issues begin to disproportionately outnumber the closed issues and prevent delays in your workflow.
Before You Begin
Make sure the issue feature is enabled if you want to use this report.
Report Overview
You can view all of a project's reports by clicking Analyze in the navigation menu. The cumulative flow report is under the Other section.
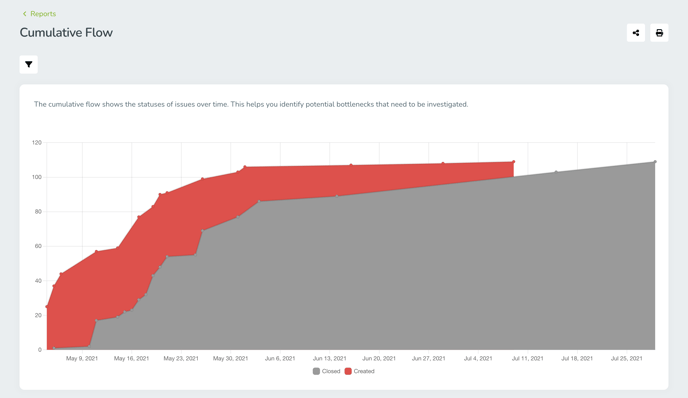
Cumulative Flow
The cumulative flow report is a graph that visually displays the relationship between created and closed issues. The red line on the graph represents all created issues and a grey line is for all the closed issues.
You can project the statistics of your future project issues, based on the cumulative flow. The report gives you an indication of how ‘created’ issues relate to ‘closed’ issues and when you might reach the ‘zero’ point.
Customize the Report
You can customize some aspects of the report to display the data relevant to you and in the form that you want. To customize your report, hover your cursor over the graph and click the three dots in the top right of the section. You can customize the following:- Values: Check the box to display the data labels on your graph, showing the number of created and closed issues.
- Scale: Select the period of time that you want to see the data from (a day, a week, a month).
- Legend: Select if you want the graph legend to appear to the left or bottom of the display.
If there’s just specific data you want to see in the cumulative flow report, click the filter icon in the top left and select the filter options relevant to you.
Share or Print Reports
You can share reports in TestMonitor either as a link to other project members or by printing them as a PDF.
To share a report with another user, click the share icon in the top right. A popup window will open where you can select as many project members as applicable from the dropdown and write a message for them. Users will receive both an email and a notification in TestMonitor about the report shared with them. Clicking the link, or the notification will open the cumulative flow report page with any applied filters.
Another option is to print the report (or save it as a pdf). To print the report or save and share it as a PDF click the print icon in the top right.
Make sure you have applied any relevant filters or customizations before sending. Any filters and customizations you applied to the report will determine how the report looks when you send or print it.