
With our Power BI connector, you can build your own dashboards and reports using up-to-date data from your TestMonitor projects. Refresh your report at any time to load the latest data.
In this article, you'll learn how to install, configure, and use the custom connector to bring your TestMonitor data into Power BI.
About Microsoft Power BI
Power BI is a business intelligence and reporting tool from Microsoft that allows you to visualize data from a wide range of sources. With our custom Power BI connector, you can connect directly to your TestMonitor environment and analyze your test cases, issues, test runs, and results.
Features
Here’s what you can do with the TestMonitor Power BI connector:
-
Secure authentication using your personal TestMonitor API key
-
Visualize key test metrics from your projects, refreshed whenever you need them
-
Access core project data including issues, test cases, test runs, and test results
-
Automatic handling of pagination, ensuring full datasets are retrieved
-
Built-in relationships, with support for linked data like statuses and assignees
-
Easy-to-use navigation table for selecting datasets
-
Multi-project support, so you can connect to several projects in the same report
Prerequisites
To use the TestMonitor Power BI connector, make sure you have the following:
-
A TestMonitor account with access to your project data
-
A valid API key, which you can generate on your My Profile page in TestMonitor
-
The custom connector file (use the download link below).
-
Microsoft Power BI Desktop for Windows (latest version recommended). The connector doesn’t work in the Power BI web editor or on Mac.
Downloads
The available connector versions are listed below. We recommend updating to the latest version to benefit from the most recent improvements.
| Version | Changes | |
| 1.1 (latest) | Updated for TestMonitor 8.4 | Download |
| 1.0 | Initial release |
Connecting to Power BI
Installing the connector
If you are installing the connector for the first time, follow the steps below.
-
Download the latest connector from the Downloads section above.
-
Place the file in the [Documents]\Power BI Desktop\Custom Connectors folder on your computer. If the folder doesn’t exist, you can create it manually.
-
In Power BI Desktop:
-
Go to File > Options and settings > Options.
-
Under Security > Data Extensions, select (Not Recommended) Allow any extension to load without validation.
Enabling this option is required to load the TestMonitor connector. The connector only communicates with your own TestMonitor environment, using the API key you provide. -
Click OK and restart Power BI.
-
Updating the connector
When a new version of the connector is released, you can update it by replacing the existing file:
-
Download the new connector from the Downloads section above.
-
Close Power BI Desktop.
-
Go to the [Documents]\Power BI Desktop\Custom Connectors folder and replace the existing TestMonitor.mez file with the new one. Make sure only one TestMonitor connector file is in this folder.
-
Start Power BI Desktop again.
-
Open your report and click Refresh to load your data using the new version.
-
If you're asked for your credentials again, select API Key and enter your personal API key.
Connecting to TestMonitor
-
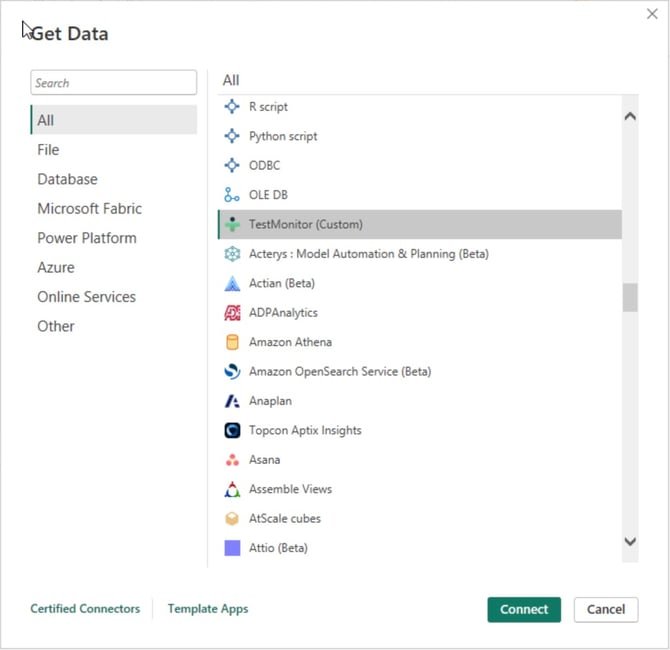
In Power BI Desktop, click Get Data.
-
Search for or select TestMonitor from the list of connectors.
-
Power BI will show a message that the connector is provided by a third party. Click Continue.
- Click Connect.
-
When prompted, enter the following:
-
Domain – The address of your TestMonitor environment, without https:// (e.g.,
yourteam.testmonitor.com) -
Project ID – The ID of the project you want to report on
-
-
Click OK.
-
When asked for credentials, choose API Key and paste in your personal API key from your TestMonitor user settings.
Choosing your data
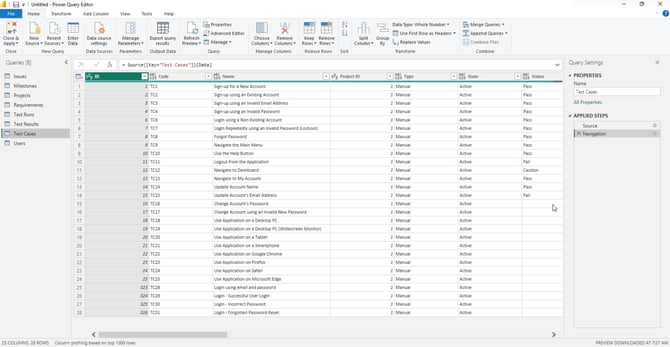
After connecting, you’ll see a list of available data sets:
- Requirements
- Risks
- Test Cases
- Milestones
- Test Runs
- Test Results
- Issues
- Projects
- Users
Select one or more tables to load into Power BI. You can now use these to build visual dashboards and reports using TestMonitor data.
Frequently Asked Questions
Where can I find my project ID?
You can find your project ID in the URL when viewing your project in TestMonitor. It looks like this:https://yourteam.testmonitor.com/projects/**123** — in this case, 123 is the project ID.
Can I connect to multiple projects?
Yes! You can add multiple instances of the connector with different project IDs. Each connection will be treated separately in Power BI.
Can I refresh the data?
Yes. In Power BI Desktop, click Refresh to load the latest data.
To refresh a published report in Power BI Service, you need an on-premises data gateway (standard mode), because Microsoft only supports custom connectors through a gateway. Place the TestMonitor.mez file in the gateway’s custom connectors folder and enable custom connectors in the gateway settings. See Microsoft’s documentation on using custom connectors with the on-premises data gateway for details.
Troubleshooting
I can't find the connector
Make sure the .mez file is placed in the correct folder, the "(Not Recommended) Allow any extension to load without validation." option is enabled, and Power BI has been restarted.
I'm unable to connect to TestMonitor
Check the following:
-
The domain is entered without https:// (e.g., yourteam.testmonitor.com).
-
Your API key is copied completely, without extra spaces.
-
You have access to the project you’re connecting to.
-
The project ID is correct (see Where can I find my project ID?).
Data shows only 15 records
This happens with older versions of the connector. Update to the latest version (see Updating the connector) and refresh your data.
Too many requests
TestMonitor limits the number of API requests per minute. The connector already slows down automatically to stay within this limit, but very large projects or many connections at once can still exceed it. If this happens:
-
Wait a few minutes and refresh again.
-
Load only the tables you need.
- Avoid refreshing multiple reports or projects at the same time.