TestMonitor offers summary reports to help you gain insight into how your project is doing. The reports provide an overview of selected data for your project. There are three different summary reports: a project summary, a milestone summary, and an issue summary.
Using these reports, you can easily generate a progress report for stakeholders with clear data and graphs to help them see where a project stands. The three types of summary reports mean you can show as much information about the project as you want. For example, a project summary is broad, whereas a milestone summary is more detailed. This information can also be used to forecast future results and keep your resource planning dynamic and responsive to the project needs.
Before You Begin
To use the issue summary, make sure your project has the issue feature enabled. The feature you enable (i.e., requirement, risk, or application) will impact which graphs you find in your summary reports.
Report Overview
You can view all of a project's reports by clicking Analyze in the navigation menu. The three summary reports are at the top of the page.
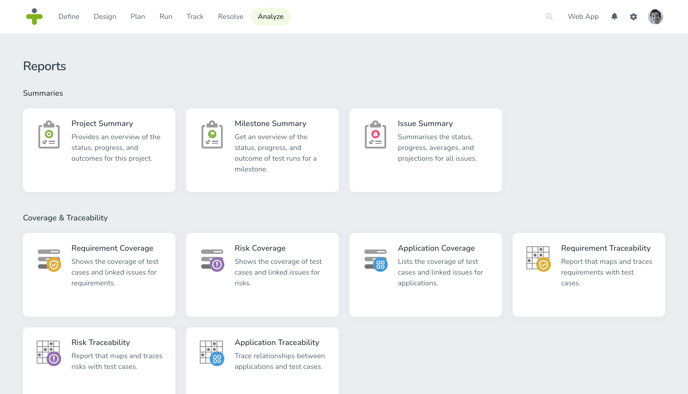
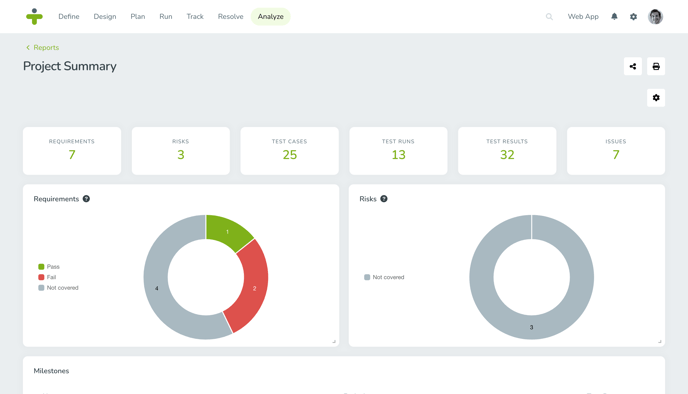
Project Summary
The project summary report provides an overview of the status, progress, and outcomes of the project. The project summary also includes counters, for risks, testers, and test cases and their estimates. The report shows information about the classification and outcomes of risks and types and outcomes of requirements as well as an overview of the milestones and their progress. The activity flow shows how many test results are produced by the testers in the project. This report gives the highest level overview of your project and everything going on in it.
Milestone Summary
The milestone summary report provides an overview of the status, progress, and outcome of test cases and test runs for a specific milestone within the project. When you select the milestone summary report, you will first have to pick which milestone you want to see the data for, allowing you to drill down into its details.

The report shows counters for a quick insight into, for instance, the time remaining until the milestone’s end date and the number of test runs per status. The report includes an activity flow to see the course of test results provided. The two main graphs in the milestone report are for test cases and test runs and show the progress testers have made.
A test case will be considered "tested" as soon as one assigned tester has provided a test result, even if multiple testers are assigned to the same test case.
The outcome of a test case is determined by the most recent test result.
A test run will be considered "tested" as soon as every tester assigned to the run has provided a result for each test case in the test run.
You can view one milestone at a time and switch between milestones by using the top-left dropdown.
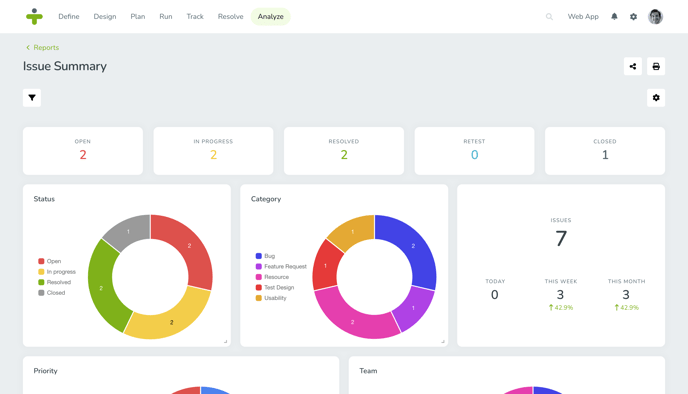
Issue Summary
The issue summary report summarizes the status, progress, averages, and forecasts for all issues in a project. Understanding the issues in your project and having access to a summary of this information allows you to analyze your time and project progress.
Using this report, you can determine how long the mean time to repair an issue (until the status is set to resolved) or the average lifespan of an issue (until the status is set to closed).
This report also includes a separate chart for each issue detail, including the issue’s status and priority.
Customize Reports
You can customize summary reports to display the data relevant to you and in the form that you want. Each of the sections on a summary report page can be dragged and dropped to rearrange their location on the page. Chart sections can even be expanded to be larger by clicking and dragging from the bottom right corner.
You can not only resize graphs, but also switch between a pie chart, donut chart, and bar chart to display information. Click the three dots in the corner of a section to select the type of display and options such as whether to display a chart legend.
If there are some sections you don’t want to be displayed on your summary report, click the gear icon in the top right and deselect sections you want to be hidden. If there is just specific data you want to see in the summary report, click the filter icon in the top left and select the filter options relevant to you.
Share or Print Reports
Sending a TestMonitor summary report is a simple process, you can either share it online with other project members or via a PDF download.
Make sure you have customized your report with filters and chart settings before sending a summary report. Any filters or customizations you applied to the report will determine how the report looks when you send or print it.
To share a report with another user, click the share icon in the top right. A popup window will open, allowing you to select project members from the dropdown and write a message. Users will receive both an email and a notification in TestMonitor about the shared report. Clicking the link, or the notification, will open the summary report page with any applied filters and customizations.
To print or share the report as a PDF, click the print icon in the top right. A print screen will open with the option to Save as PDF. When you’re done, the report will be saved to your device for you to send as an attachment.