Coverage reports show how many test cases have been executed, their statuses, and coverage per requirement, risk, application, or test case. They give a quick view of project progress, highlight untested cases, and reveal which objects lack linked test cases.
Traceability matrices visualize the relationships between test cases and requirements, risks, or applications. At a glance, you can see what each test case is linked to, whether it’s been tested, and its result, providing a clear overview of coverage across your project.
Before You Begin
In order to see the coverage reports and traceability matrices for the data you’d like to review you need to make sure that the feature for that data is first enabled. For example, enable the requirements feature for requirement reports and enable the risks feature for risk reports.
Applications are created in the TestMonitor settings for your entire environment, not within an individual project like requirements and risks. Only the applications that are linked to your projects test cases will appear in your reports.
Report Overview
You can find the coverage and traceability reports by clicking Analyze in the navigation menu. The second row under the heading Coverage & Traceability has all of the related reports.
Coverage Reports
TestMonitor offers four types of coverage reports. All of the reports work the same, but focus on a different perspective, namely requirements, risks, applications or test cases.
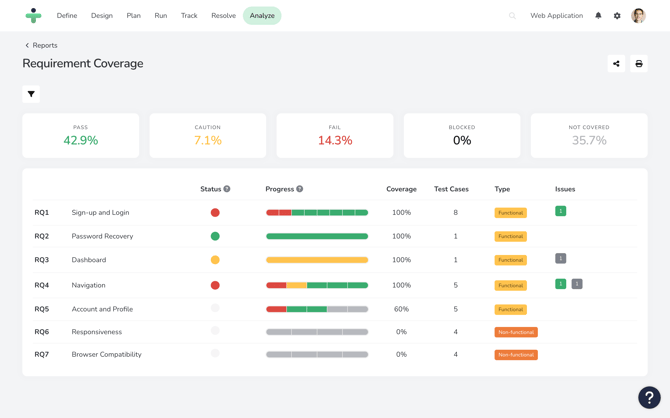
For example, the requirement coverage report shows all the requirements defined within the project, along with the associated test case count for each requirement. The report also calculates a status for each requirement based on its test results. In addition, you can also see the number of related issues and their status for each requirement.
The explanations below are for the requirements coverage report, but the functionality and general fields are the same for both risk and application coverage reports.
- Requirements: A list of all the requirements in your project. Clicking on one of the listed requirements (or code) brings you to the details page for review.
- Status: As soon as all linked test cases are completed this column will display the most severe test case status for the object.
- Progress: This bar covers all of the test cases linked, their completion level, and their outcome. For example, a green bar represents a test case that passed without problem. You can click on a result and open the test result detail page. If a test case has not been covered yet, clicking on the test case will bring you to the test case detail page.
- Coverage: This percentage represents the number of test cases run based on the total number of all linked test cases.
- Issues: The number of issues based on their status linked to any of the object’s related test cases.
The coverage report also allows you to see if there are any requirements that aren’t specified into test cases. They show up in the report without linked test cases.
To view the information most relevant to you, you can filter the report data at any time by Type, Milestones, and Tags. When (multi-)select custom fields are defined for requirements or risks, they are available as filter as well.
Traceability Matrices
As with the coverage reports, the traceability matrices in TestMonitor are available for requirements, risks and applications.
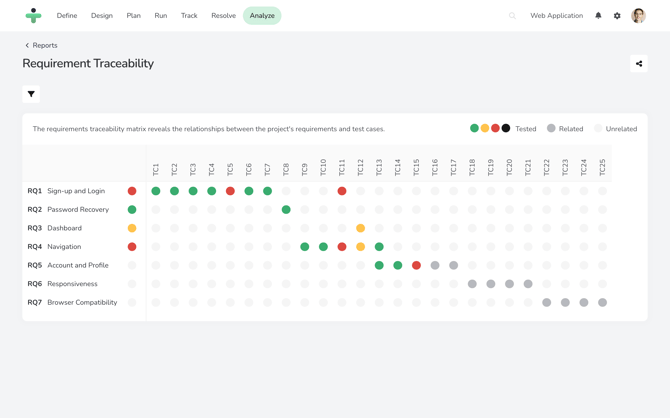
The explanations below are for the requirements matrices, but the functionality is the same for both risk and application matrices.
The vertical axis shows all requirements defined and the horizontal axis shows all test cases in your project.
You can click on any requirement in the vertical axis to see the object’s details page.
For each test case you can see whether it is related to the requirement under review along with if the test case has been tested and what the test case status is. After all linked test cases are tested, you will also see the overall status in the circle next to the requirement name. You can also hover over this circle to see the progress of all test cases linked.
To view the information most relevant to you, you can filter the matrices display by related data of the report you are reviewing, such as Type, Test Case Folder, Milestones and Tags. When (multi-)select custom fields are defined for requirements or risks, they are available as filter as well.
Share or Print Reports
You can share reports in TestMonitor with a link to other project members. To share a report with another user, click the share icon in the top right. A popup window will open where you can select as many project members as applicable from the dropdown and write a message for the users. Users will receive both an email and a notification in TestMonitor about the report shared with them. Clicking the link, or the notification will open the report page with any applied filters.
Another option for the coverage reports is to print the report (or save it as a pdf). To print the report or save and share it as a PDF click the print icon in the top right.
Make sure you have applied any relevant filters before sending. Any filters you applied to the report will determine how the report looks when you send or print it.